

- Trace individual LLM calls and full application pipelines.
- Collect and query user feedback.
- Log metadata and use it for filtering and A/B testing.
- Use monitoring dashboards to track production performance.
Prerequisites
Before you begin, make sure you have:- A LangSmith account: Sign up or log in at smith.langchain.com.
- A LangSmith API key: Follow the Create an API key guide.
- An OpenAI API key: Generate this from the OpenAI dashboard.
Prototyping
Having observability set up from the start lets you iterate faster. You can see exactly what is being sent to the model, what is coming back, and where time is being spent, without adding print statements or running a debugger.Set up your environment
Set the following environment variables in your shell:LANGSMITH_PROJECT environment variable. If this is not set, LangSmith will create a default tracing project automatically on trace ingestion.
You may see these variables referenced as
LANGCHAIN_* in other places. Both work, but LANGSMITH_TRACING and LANGSMITH_API_KEY are the recommended names.Trace LLM calls
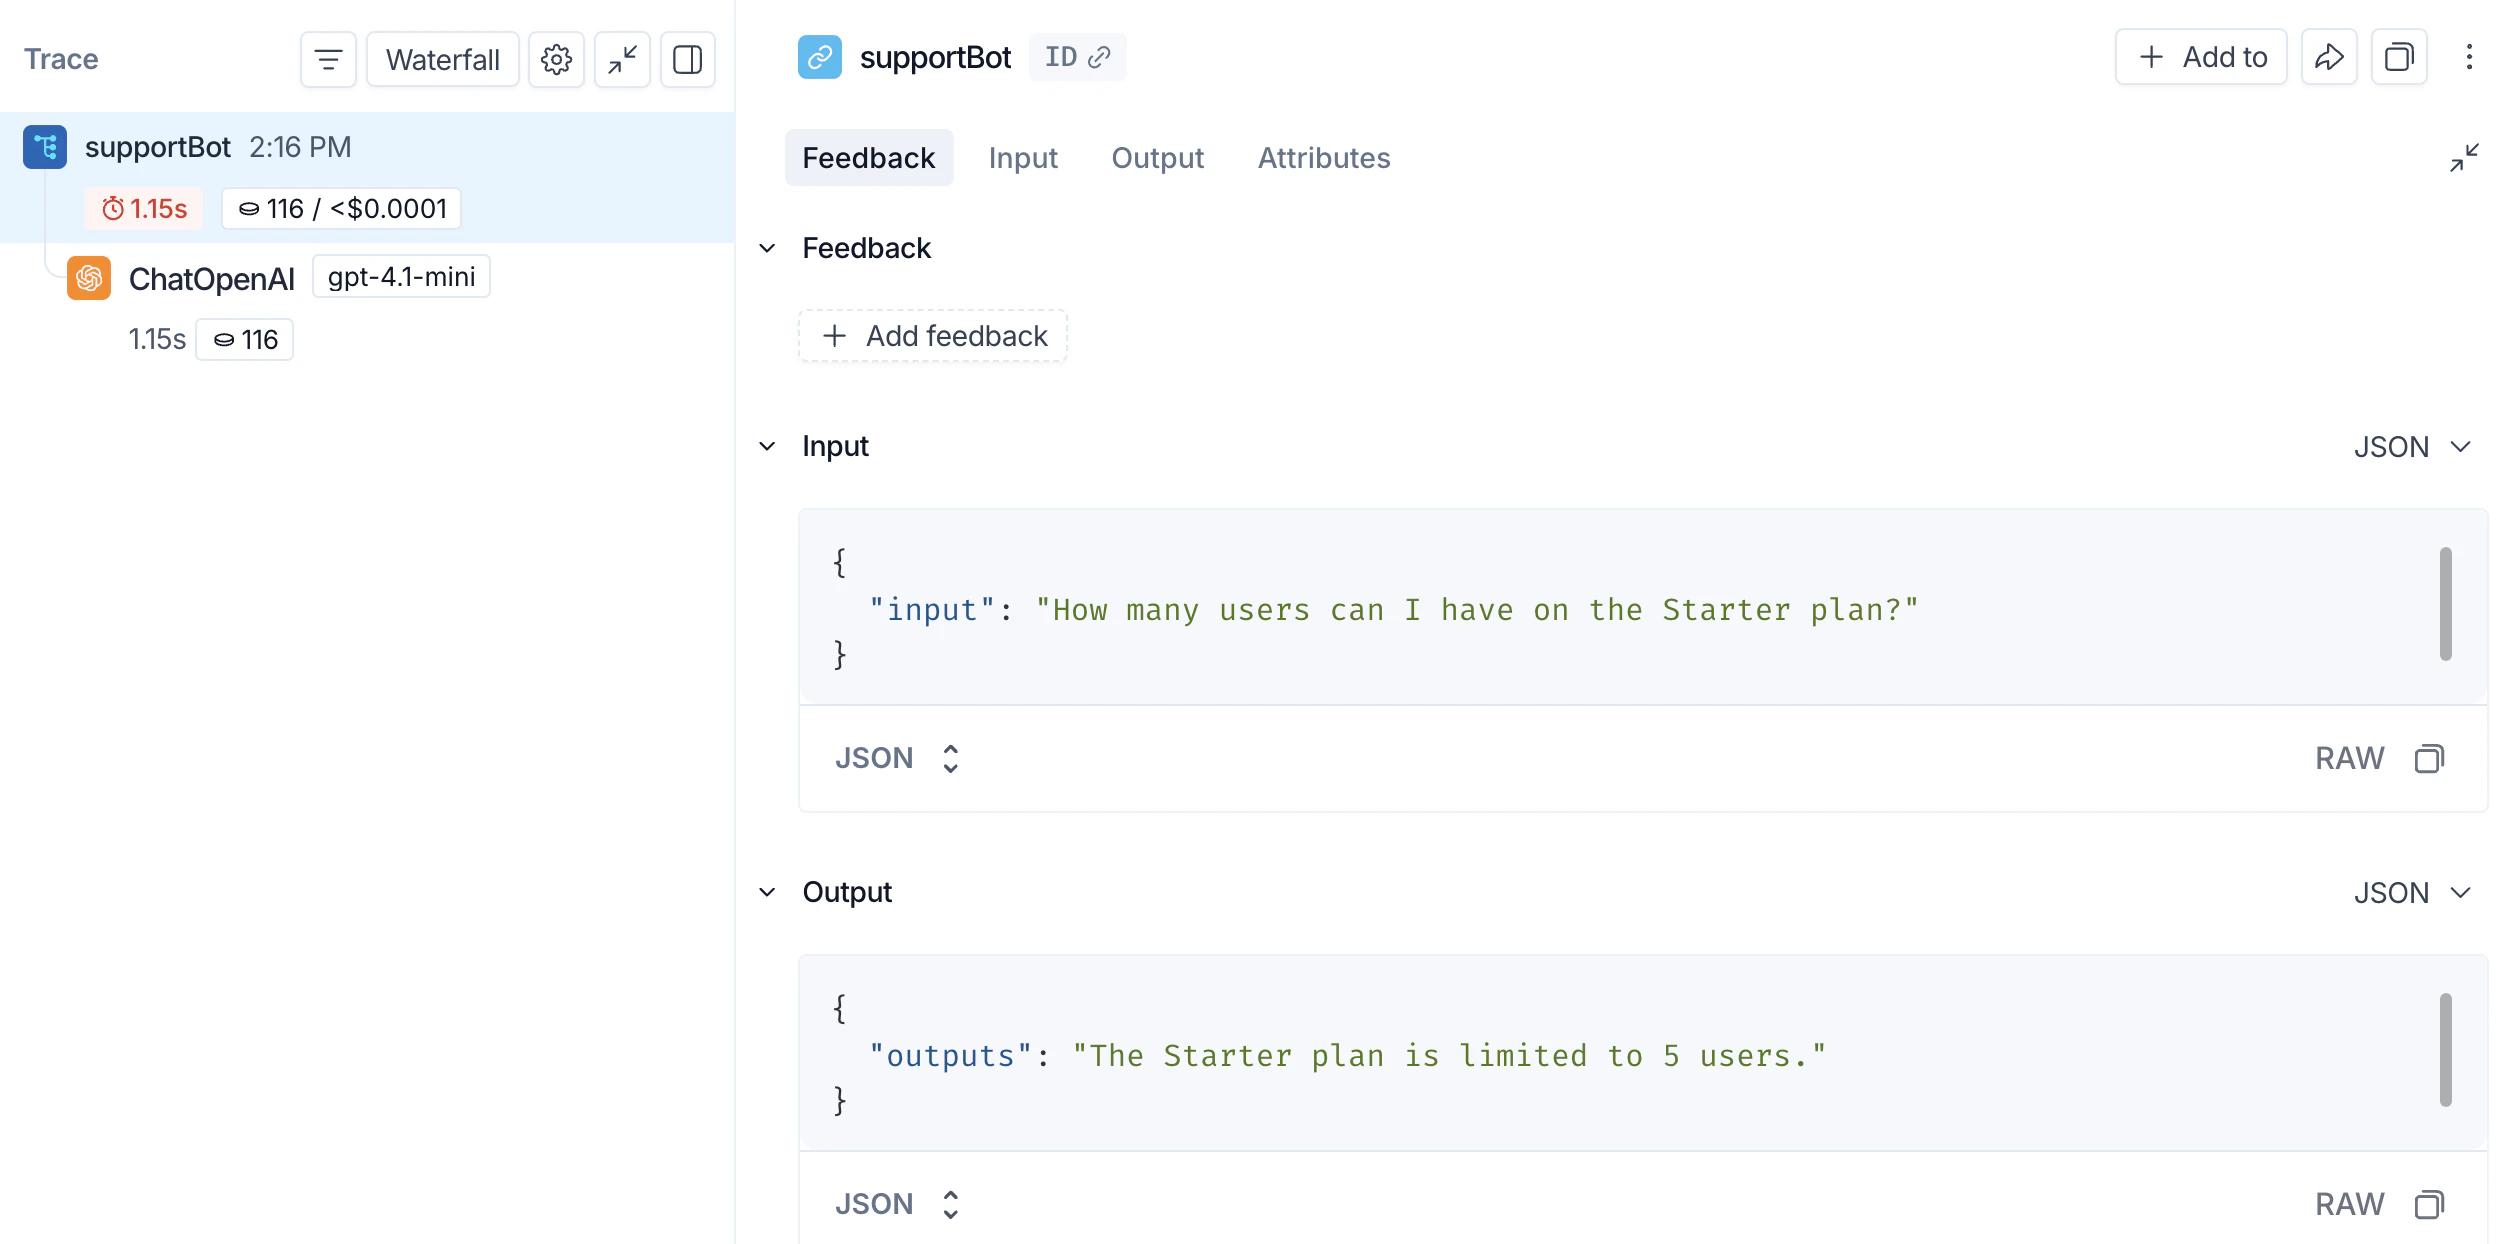
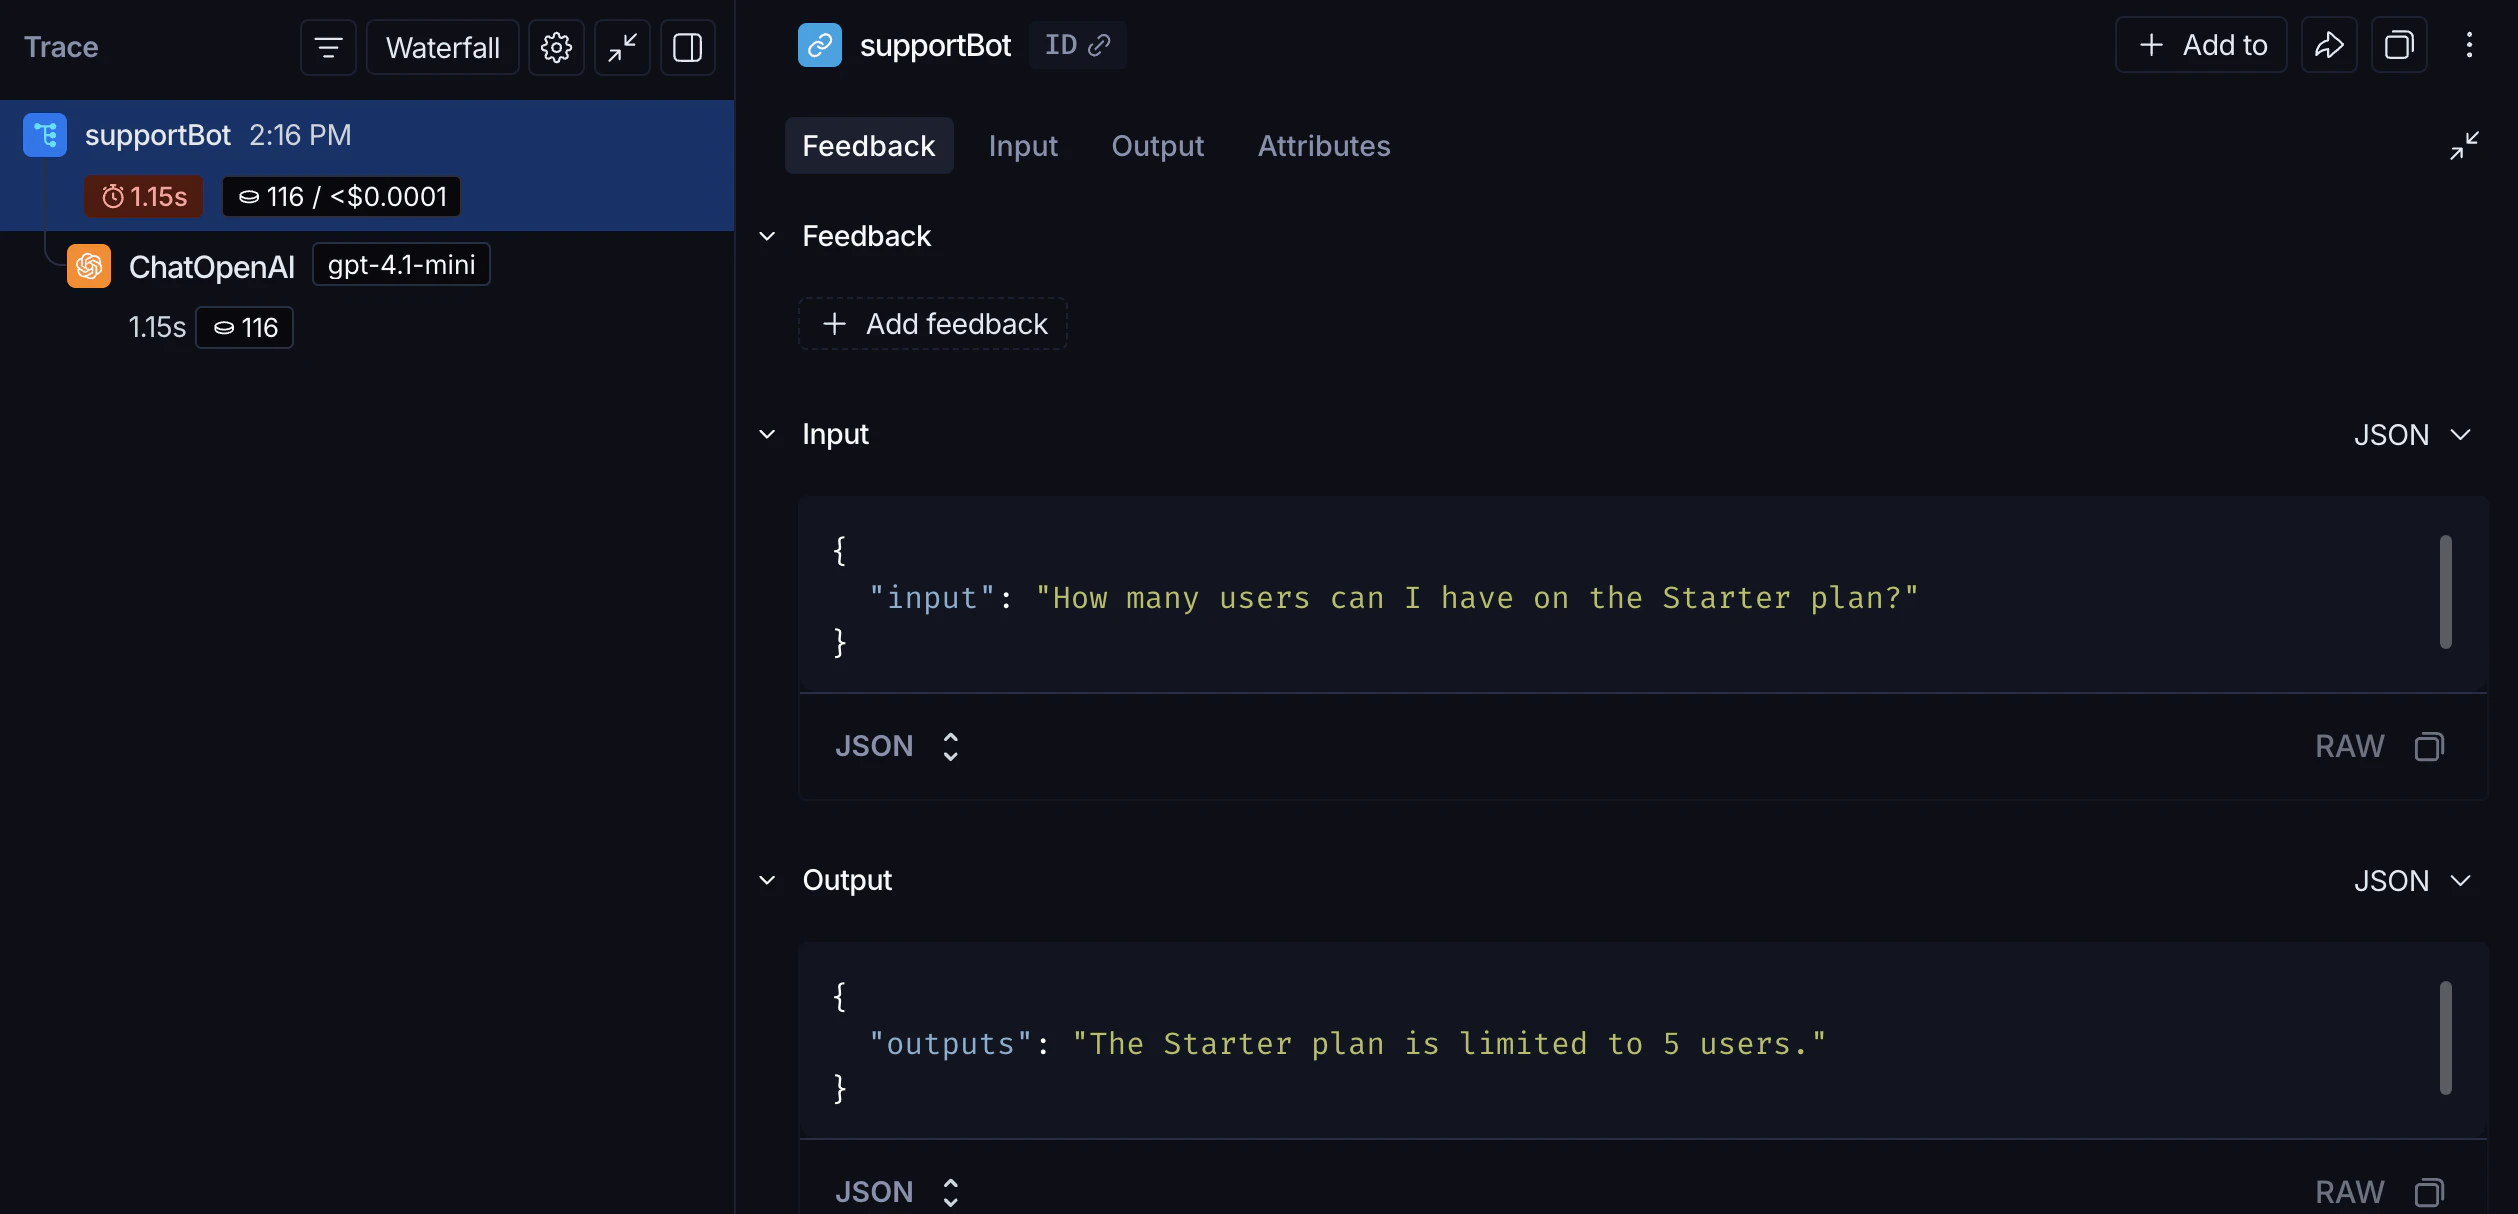
Start by tracing your OpenAI calls, where the model is actually invoked. This gives you immediate visibility into the prompts your app sends and the responses the model returns. Wrap the OpenAI client withwrap_openai (Python) or wrapOpenAI (TypeScript). Create a file called app.py (or app.ts) with the following code:
support_bot("How many users can I have on the Starter plan?") produces a trace of the OpenAI call.
Trace the whole pipeline
Tracing the LLM call is useful, but tracing the full pipeline (including retrieval) gives you a complete overview of your application’s behavior. Add@traceable (Python) or traceable (TypeScript) to the main function:
support_bot("How many users can I have on the Starter plan?") now produces a trace of the full RAG pipeline.
Beta testing
Once your app is working well in prototyping, you release it to a small group of real users. At this stage, you often don’t know exactly how users will interact with your app, so you need richer observability. You want to understand not just what the app did, but how users responded to it.Collect feedback
Linking user feedback to specific traces lets you identify which responses were helpful or unhelpful. Updateapp.py (or app.ts) from the previous step to add a run ID to each call and attach a score afterward:
In production, these two pieces would live in separate locations: the
support_bot call with run_id stays in your app, and create_feedback moves to whichever endpoint receives user feedback (for example, a /feedback API route). The run_id is passed from one to the other so the feedback can be linked to the correct trace.Log metadata
Metadata lets you tag runs with attributes useful for filtering and comparison. For example, which model version was used or which user made the request. The following example traces both the retriever (withrun_type="retriever") and the main function (with a metadata attribute for the model name):
Production
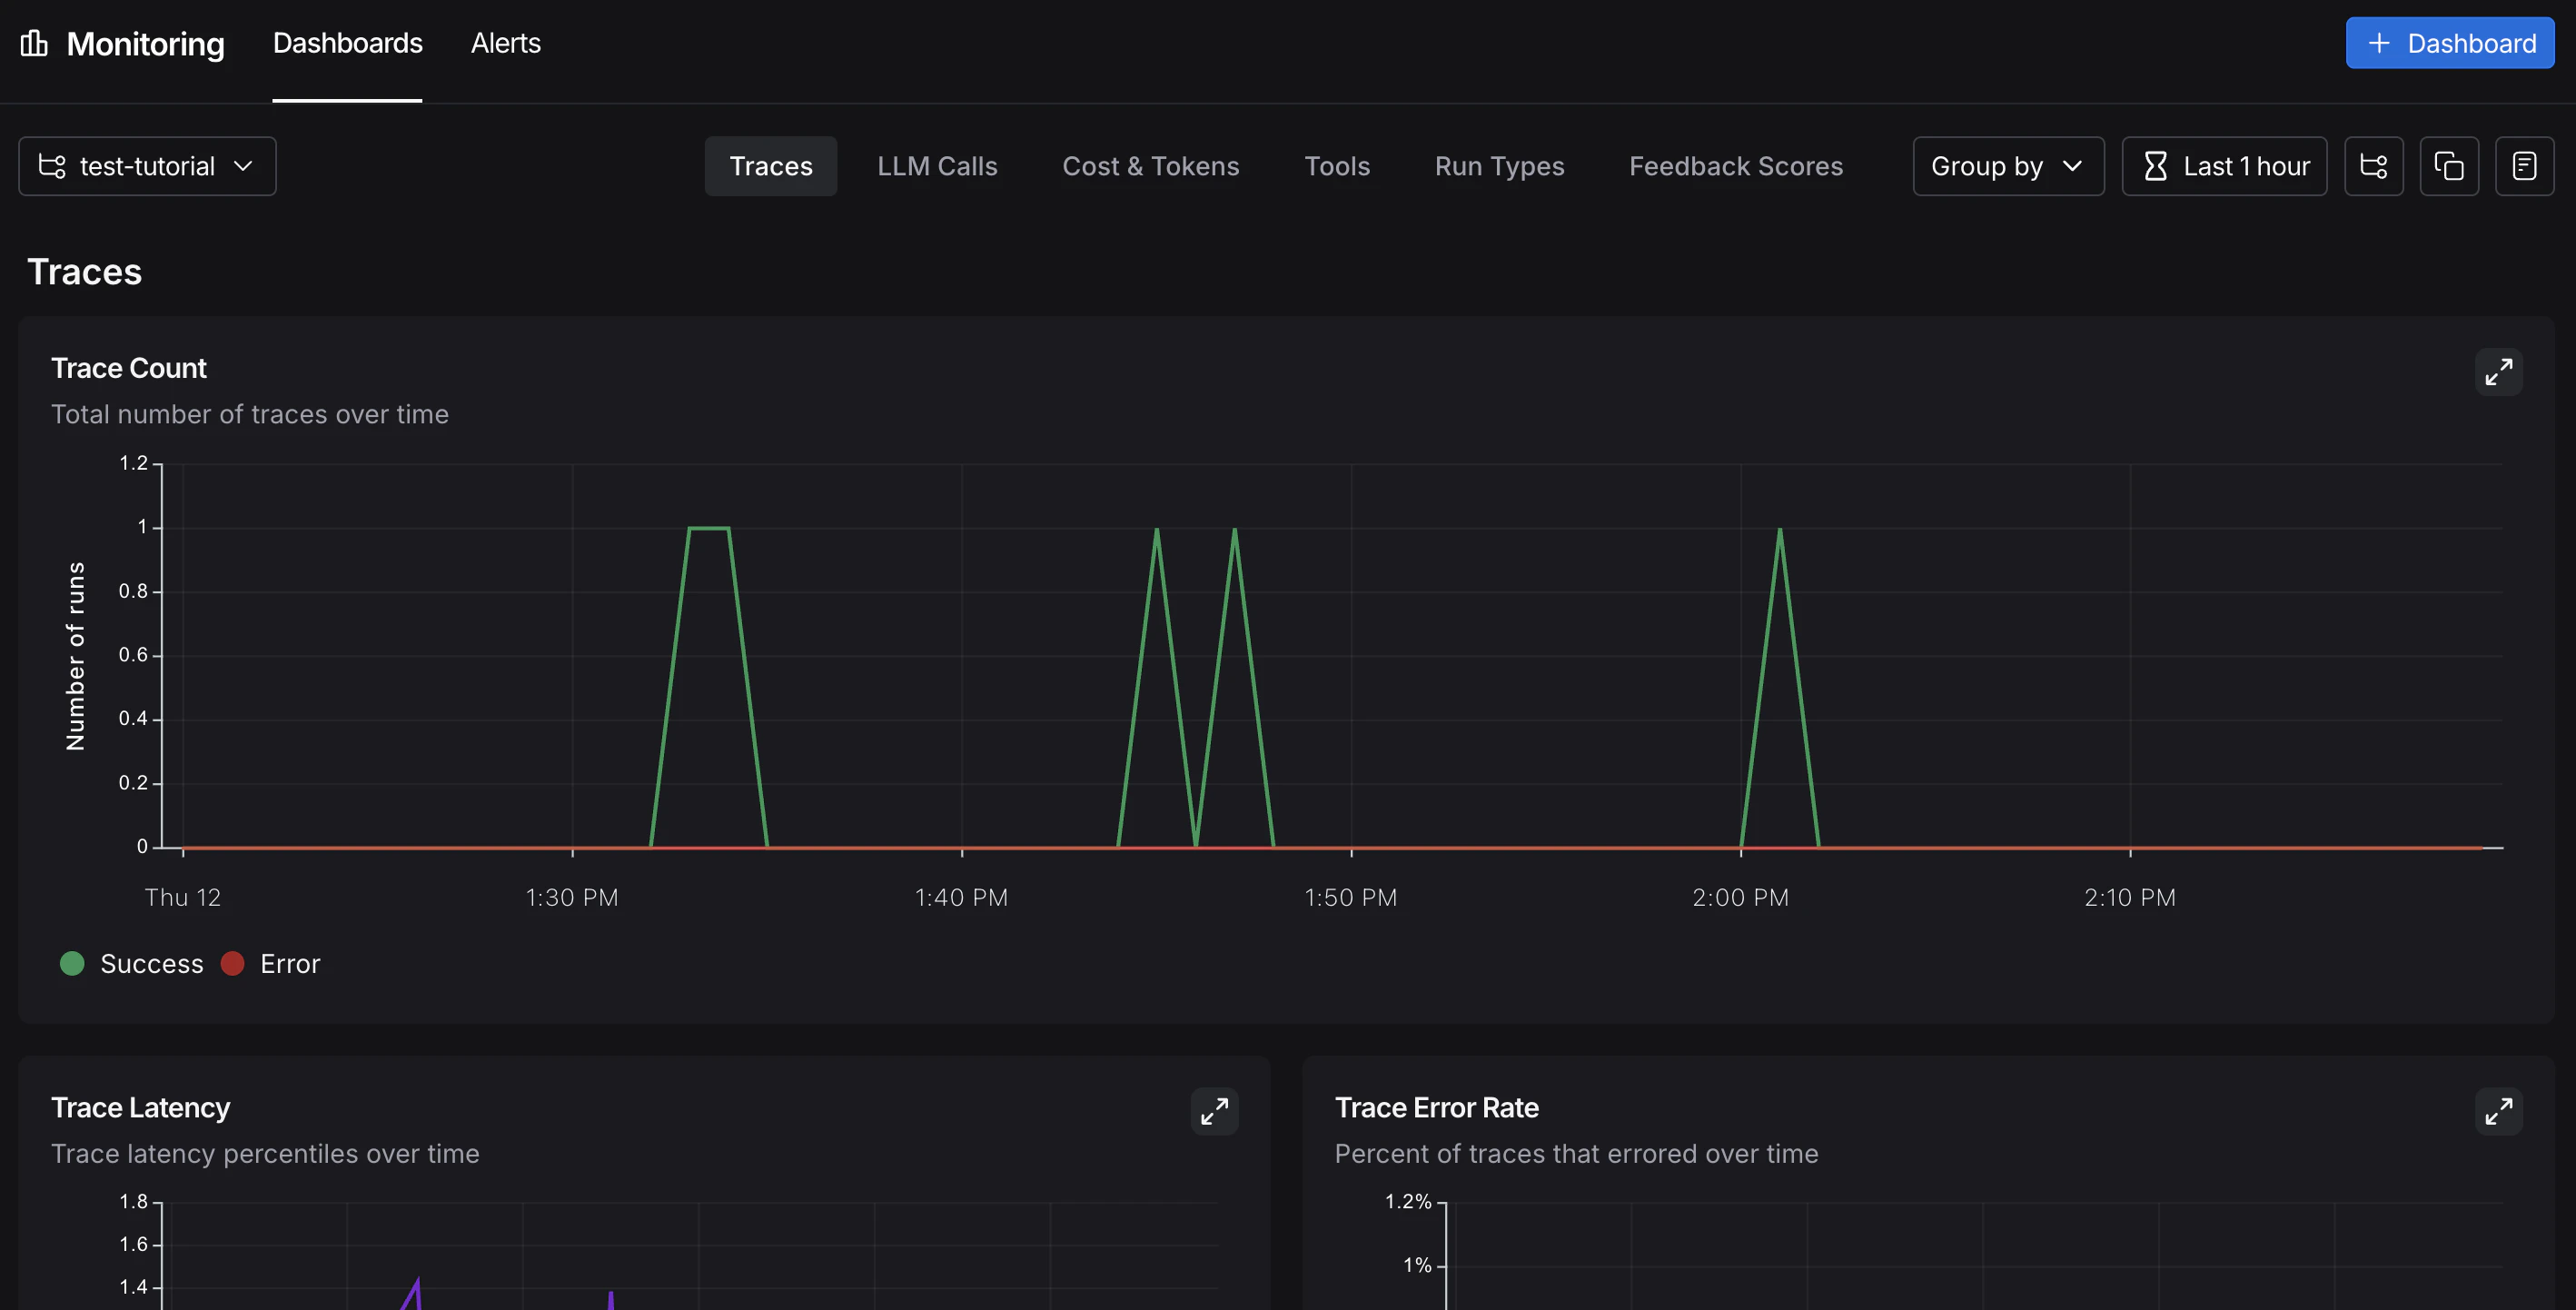
With strong observability in place, you can confidently ship to production. In production, you have significantly more traffic and can’t examine every trace individually. LangSmith provides monitoring tools to help you understand aggregate behavior and drill down when something looks wrong.Monitoring
In the UI sidebar, select Monitoring, then choose a tracing project from the dropdown at the top left. Charts display key metrics for the project over time, including trace count, latency, error rate, feedback scores, and costs. For more on available metrics and chart configuration, refer to Dashboards.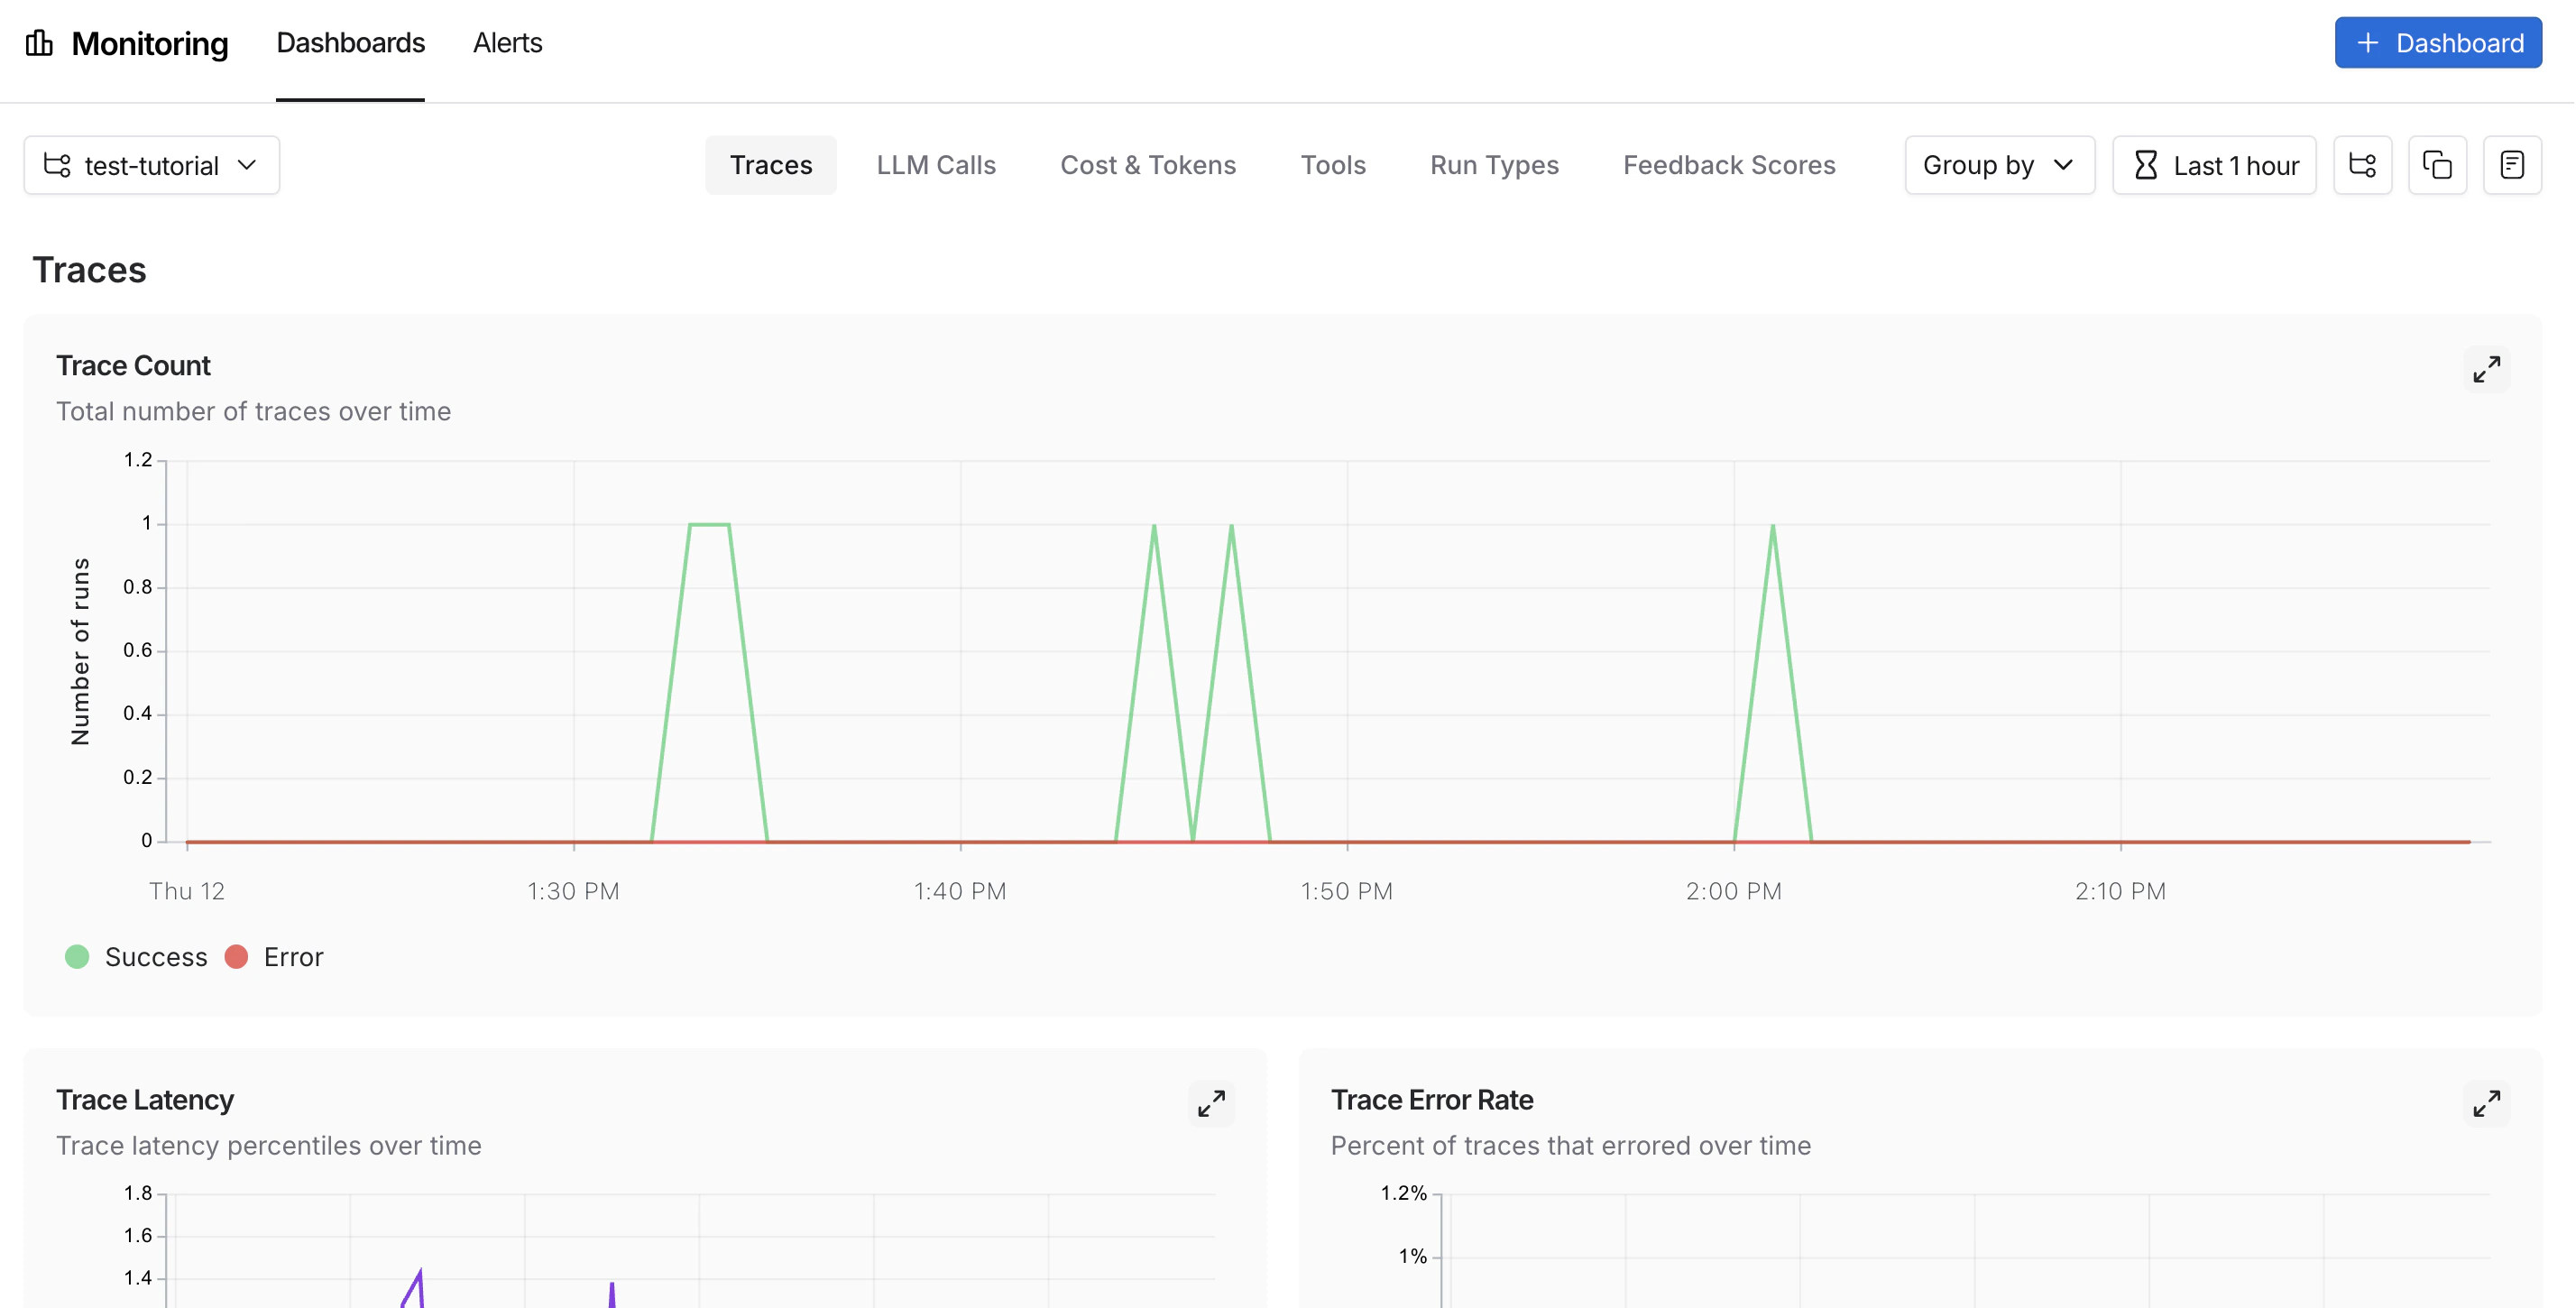
A/B testing
Group-by functionality requires at least two different values for a given metadata key.
llm metadata attribute, you can group monitoring charts by that attribute to compare model performance over time. From Monitoring in the UI sidebar, click Group by in the top left corner, select Metadata from the dropdown, then select llm. The charts update to show results grouped by that attribute. For more on grouping and custom charts, refer to Dashboards.
Drilldown
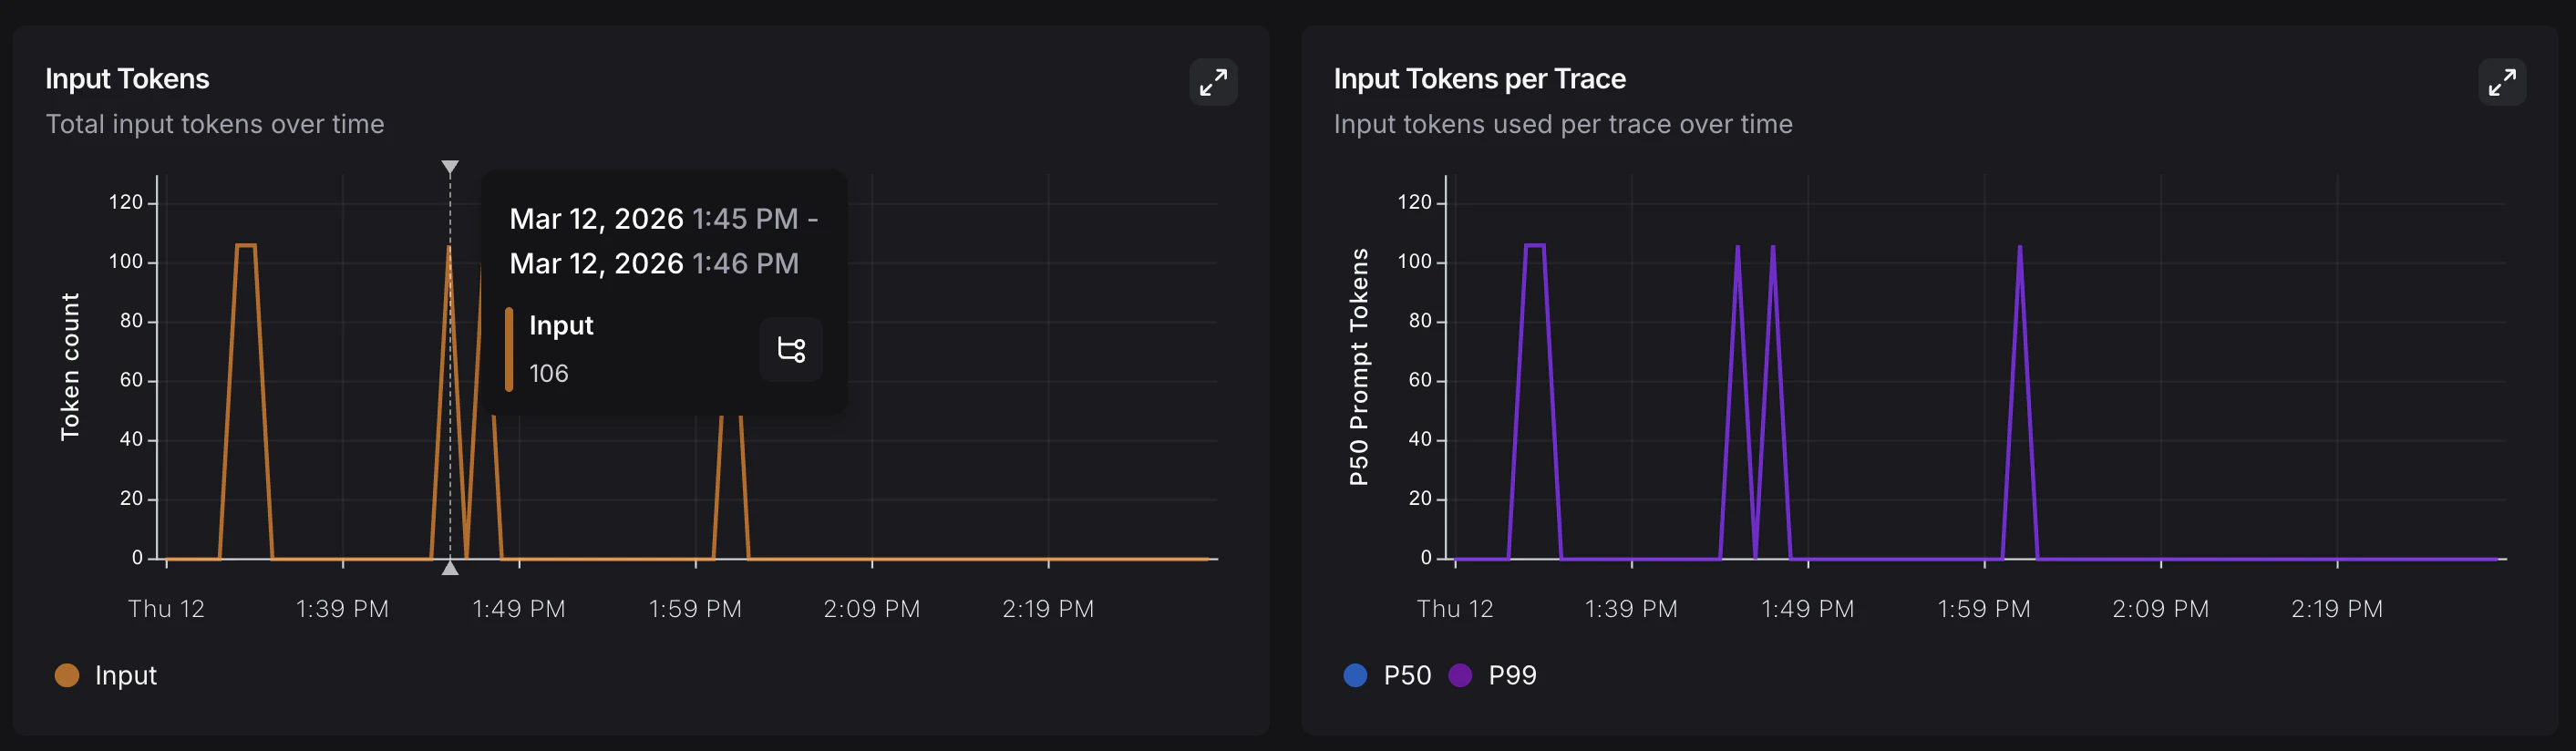
When a monitoring chart shows something unexpected, click a data point to freeze the tooltip, then click the metric name (for example, Input) to jump to the filtered runs table for that time window. For more on searching and filtering runs, refer to Filter traces.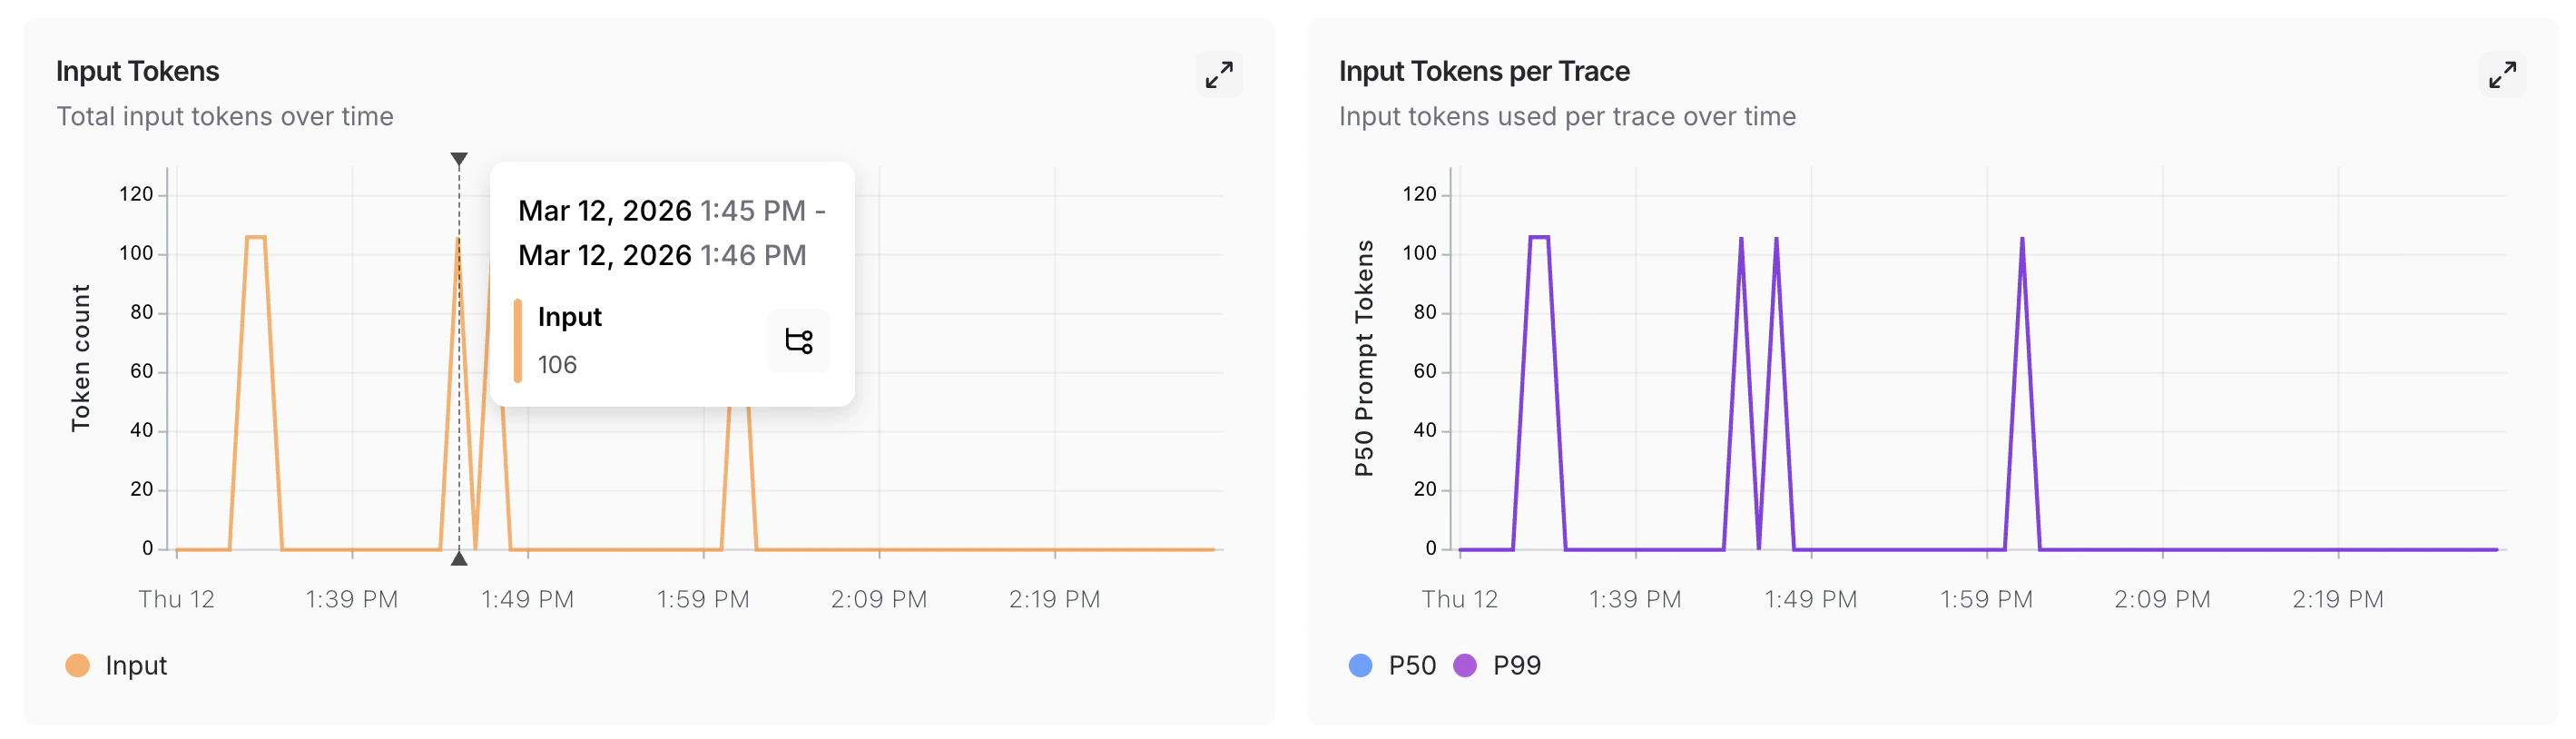
Conclusion
In this tutorial, you added LangSmith observability to an application across its full development lifecycle. The same tracing setup that helps you iterate quickly during prototyping will continue to provide value in production. You’ll have visibility into individual traces and aggregate performance trends. For more, see:- Observability concepts: terminology and core ideas.
- Tracing integrations: LangChain, LangGraph, Anthropic, and other providers.
- Automations: rules and online evaluations that run automatically on your traces.
Connect these docs to Claude, VSCode, and more via MCP for real-time answers.